Hi,
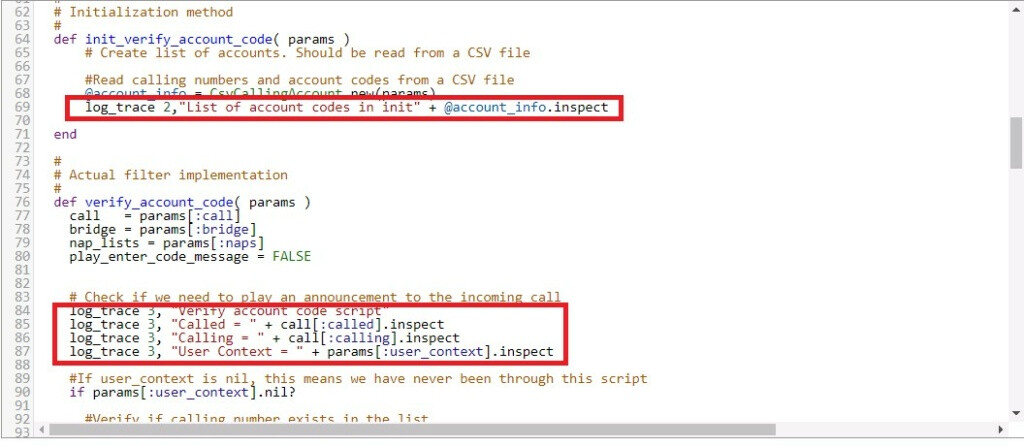
I am trying to debug a script and I don’t recall how to see the output of the log_trace. I seem to recall it’s on the OS? Please let me know how I can see it and what the different Levels are and what each level means.
Hi,
I am trying to debug a script and I don’t recall how to see the output of the log_trace. I seem to recall it’s on the OS? Please let me know how I can see it and what the different Levels are and what each level means.
Hi,
you can see the result of the print command in the gateway application log:
/lib/tb/toolpack/setup/12358/3.2/apps/gateway
You can also get it in a TBreport.
You can change the trace level of the gateway to display the necessary level from the script: