Running a ProSBC on version 3.1.145.26, running into a strange issue where our Call Trace list is not showing the correct call leg data. Calls are working fine and routing with no issue. SBC status page has no errors and everything is green:
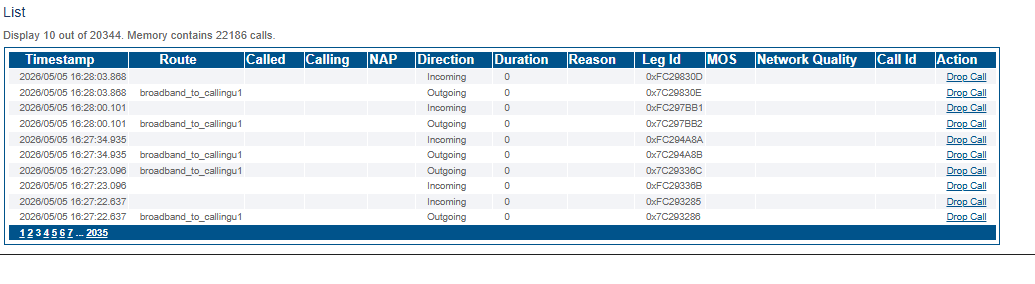
The blank columns in Call Trace with 22,186 records in memory (over double the 10,000 default limit) indicate the in-memory call trace buffer has overflowed and its internal index likely got corrupted. The data structures that store the per-leg fields (Called, Calling, NAP, Call ID, etc.) are no longer being populated properly, even though the system is still logging entries.
Since calls are routing fine and the status page is green, this is purely a Call Trace display issue, not a call-processing problem.
To fix it: clear the in-memory call trace buffer. You can do this from the Web Portal on the Call Trace page — there’s a Clear button that resets the buffer. If it’s not exposed on your version, restarting toolpack_engine will also clear it:
sudo systemctl restart toolpack_engine
This will wipe the 22K stale records but won’t affect active calls. After the restart, new calls should appear in Call Trace with all fields populated correctly.
Underlying cause: the call trace buffer exceeded its capacity and corrupted its internal data index. This behavior may have been addressed in later releases — you’re on 3.1.145.26. As you’re considering an upgrade to 3.3.x, that would also resolve this long-term.
I would recommend doing this during a maintenance window, you may experirence an interruption in service. If you have a support contract, you may want to add professional services hours so you can have a support technician available.